Sean Reibling
YorkU Research Study Infosite
Branding
•
Design Research
•
Info Design
•
Motion
•
Packaging
•
•
Product
•
Info Design
Megan Furlong
The Door in the Wall
Branding
•
Design Research
•
Info Design
•
Motion
•
Packaging
•
•
Product
•
Print
Justin Chiu
The Electric Guitar Sound
Branding
•
Design Research
•
Info Design
•
Motion
•
Packaging
•
•
Product
•
Info Design
Justin Chiu
Fractal Flower Generator
Branding
•
Design Research
•
Info Design
•
Motion
•
Packaging
•
•
Product
•
Product
Justin Chiu
Bets and Blue Jays
Branding
•
Design Research
•
Info Design
•
Motion
•
Packaging
•
•
Product
•
Product
Justin Chiu
Authoritarianism and Air Forces
Branding
•
Design Research
•
Info Design
•
Motion
•
Packaging
•
•
Product
•
Info Design
Gajanan Ketheeswaran
Waypoint
Branding
•
Design Research
•
Info Design
•
Motion
•
Packaging
•
•
Product
•
Product
Gajanan Ketheeswaran
Nightcrawler
Branding
•
Design Research
•
Info Design
•
Motion
•
Packaging
•
•
Product
•
Motion
Gajanan Ketheeswaran
Urban Metamorphosis
Branding
•
Design Research
•
Info Design
•
Motion
•
Packaging
•
•
Product
•
Print
Megan Furlong
The Romanticization of Mental Illness
Branding
•
Design Research
•
Info Design
•
Motion
•
Packaging
•
•
Product
•
Design Research
Megan Furlong
The Performance of Self
Branding
•
Design Research
•
Info Design
•
Motion
•
Packaging
•
•
Product
•
Print
Megan Furlong
How COVID-19 Affects the Body
Branding
•
Design Research
•
Info Design
•
Motion
•
Packaging
•
•
Product
•
Info Design
Megan Furlong
Musical Movies
Branding
•
Design Research
•
Info Design
•
Motion
•
Packaging
•
•
Product
•
Info Design
Raven Sommerhalder
Cultural Identity
Branding
•
Design Research
•
Info Design
•
Motion
•
Packaging
•
•
Product
•
Print
Iris Mamac
Kainan Na
Branding
•
Design Research
•
Info Design
•
Motion
•
Packaging
•
•
Product
•
Design Research
Zornitsa Stoimenova
HORST Arts & Music Festival
Branding
•
Design Research
•
Info Design
•
Motion
•
Packaging
•
•
Product
•
Print
Mariam Hoda
MuslimFest Poster
Branding
•
Design Research
•
Info Design
•
Motion
•
Packaging
•
•
Product
•
Branding
Jethro Sanchez
Winterlude Visual Identity
Branding
•
Design Research
•
Info Design
•
Motion
•
Packaging
•
•
Product
•
Branding
Myah Wills
Myah's Mood Mapping
Branding
•
Design Research
•
Info Design
•
Motion
•
Packaging
•
•
Product
•
Info Design
Myah Wills
Intrusive Inner Voice Project
Branding
•
Design Research
•
Info Design
•
Motion
•
Packaging
•
•
Product
•
Design Research
Iris Blanco
Westminster Dog Festival
Branding
•
Design Research
•
Info Design
•
Motion
•
Packaging
•
•
Product
•
Gajanan Ketheeswaran
Floorplan
Branding
•
Design Research
•
Info Design
•
Motion
•
Packaging
•
•
Product
•
Product
Kalli Jones
Don't Judge a Book
Branding
•
Design Research
•
Info Design
•
Motion
•
Packaging
•
•
Product
•
Print
Bella Wei
Digital Ghosts
Branding
•
Design Research
•
Info Design
•
Motion
•
Packaging
•
•
Product
•
Design Research
Vyjayanthi Janakiraman
the grief is never ending but so is the love
Branding
•
Design Research
•
Info Design
•
Motion
•
Packaging
•
•
Product
•
Design Research
Hailey Luong
Just Like Home
Branding
•
Design Research
•
Info Design
•
Motion
•
Packaging
•
•
Product
•
Packaging
Ingrid Wong
Lemon Festival
Branding
•
Design Research
•
Info Design
•
Motion
•
Packaging
•
•
Product
•
Branding
Vyjayanthi Janakiraman
La Tomatina Festival
Branding
•
Design Research
•
Info Design
•
Motion
•
Packaging
•
•
Product
•
Packaging
Peri Agate
Warped Perceptions of The World
Branding
•
Design Research
•
Info Design
•
Motion
•
Packaging
•
•
Product
•
Print
Peri Agate
Sapphic Intimacy - Secrecy
Branding
•
Design Research
•
Info Design
•
Motion
•
Packaging
•
•
Product
•
Print
Peri Agate
Sapphic Intimacy - Yearning
Branding
•
Design Research
•
Info Design
•
Motion
•
Packaging
•
•
Product
•
Print
Peri Agate
Sapphic Intimacy - Gossip
Branding
•
Design Research
•
Info Design
•
Motion
•
Packaging
•
•
Product
•
Print
Peri Agate
Sapphic Intimacy - Raunchy
Branding
•
Design Research
•
Info Design
•
Motion
•
Packaging
•
•
Product
•
Print
Myah Wills
Stratford Rebranding
Branding
•
Design Research
•
Info Design
•
Motion
•
Packaging
•
•
Product
•
Branding
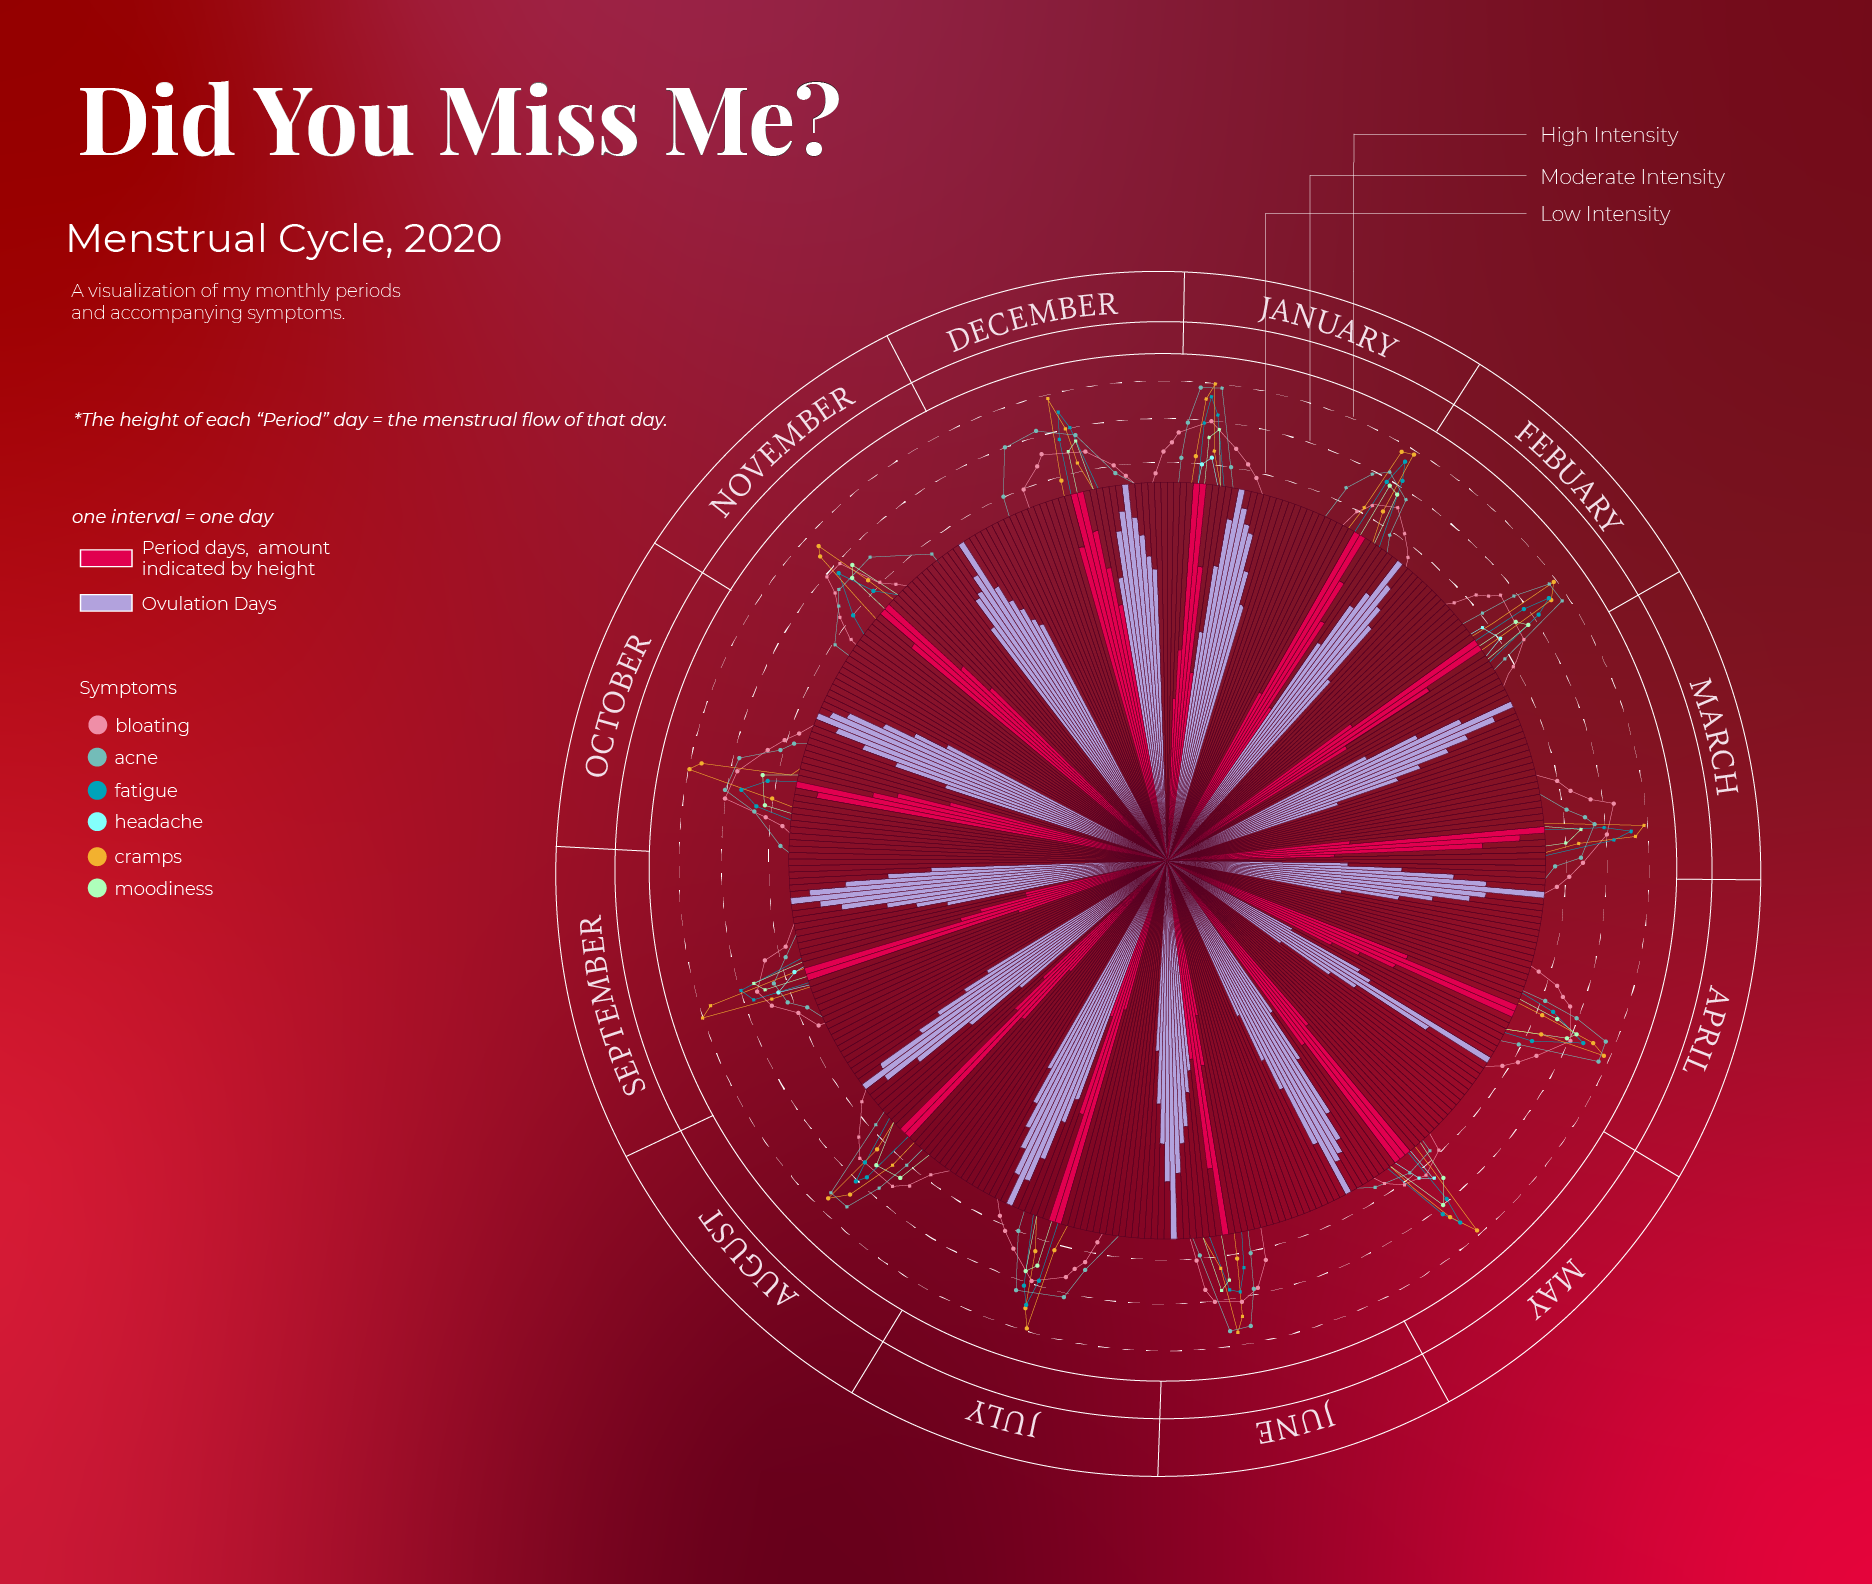
Jasmine Wong
Did You Miss Me?
Branding
•
Design Research
•
Info Design
•
Motion
•
Packaging
•
•
Product
•
Info Design
Jasmine Wong
Yum Cha Beauty
Branding
•
Design Research
•
Info Design
•
Motion
•
Packaging
•
•
Product
•
Packaging
Bella Wei
Montreal International Jazz Festival
Branding
•
Design Research
•
Info Design
•
Motion
•
Packaging
•
•
Product
•
Branding
Katherine Yu
Nuit Blanche Visual Identity
Branding
•
Design Research
•
Info Design
•
Motion
•
Packaging
•
•
Product
•
Branding
Raven Sommerhalder
Succession
Branding
•
Design Research
•
Info Design
•
Motion
•
Packaging
•
•
Product
•
Motion
Nieves Rocillo
In the Realm of Small Things
Branding
•
Design Research
•
Info Design
•
Motion
•
Packaging
•
•
Product
•
Print
Madeline Rubba
A Worker Bee's Survival Guide
Branding
•
Design Research
•
Info Design
•
Motion
•
Packaging
•
•
Product
•
Print
Nieves Rocillo
Return to Sender
Branding
•
Design Research
•
Info Design
•
Motion
•
Packaging
•
•
Product
•
Print
Nieves Rocillo
Salon Du Chocolat Festival Brand Identity
Branding
•
Design Research
•
Info Design
•
Motion
•
Packaging
•
•
Product
•
Branding
Madeline Rubba
SDG 15: Life on Land
Branding
•
Design Research
•
Info Design
•
Motion
•
Packaging
•
•
Product
•
Design Research
Nieves Rocillo
Magkasama Bilang Isa
Branding
•
Design Research
•
Info Design
•
Motion
•
Packaging
•
•
Product
•
Packaging
Kristen Chan
Visualizing WWII
Branding
•
Design Research
•
Info Design
•
Motion
•
Packaging
•
•
Product
•
Info Design
Meaghan Gonsalves
Repurposed
Branding
•
Design Research
•
Info Design
•
Motion
•
Packaging
•
•
Product
•
Branding
Meaghan Gonsalves
High Lite Cannabis
Branding
•
Design Research
•
Info Design
•
Motion
•
Packaging
•
•
Product
•
Packaging
Meaghan Gonsalves
LOG OFF Journal
Branding
•
Design Research
•
Info Design
•
Motion
•
Packaging
•
•
Product
•
Print
Meaghan Gonsalves
The New York Coffee Festival Program
Branding
•
Design Research
•
Info Design
•
Motion
•
Packaging
•
•
Product
•
Branding
Meaghan Gonsalves
Sip Sip Hooray
Branding
•
Design Research
•
Info Design
•
Motion
•
Packaging
•
•
Product
•
Print
Raven Sommerhalder
Images Festival
Branding
•
Design Research
•
Info Design
•
Motion
•
Packaging
•
•
Product
•
Branding
Peri Agate
Warped Perceptions of Self
Branding
•
Design Research
•
Info Design
•
Motion
•
Packaging
•
•
Product
•
Print
Myah Wills
Mid-Century Custom Lettering
Branding
•
Design Research
•
Info Design
•
Motion
•
Packaging
•
•
Product
•
Print
Adrianna Kirovski
Case Studies of Gothic Architecture
Branding
•
Design Research
•
Info Design
•
Motion
•
Packaging
•
•
Product
•
Print
Jethro Sanchez
STS Visual Identity
Branding
•
Design Research
•
Info Design
•
Motion
•
Packaging
•
•
Product
•
Branding
Jethro Sanchez
Pinoy Pride / Filipino Pride
Branding
•
Design Research
•
Info Design
•
Motion
•
Packaging
•
•
Product
•
Design Research
Hailey Luong
Eat Your Plants
Branding
•
Design Research
•
Info Design
•
Motion
•
Packaging
•
•
Product
•
Product
Ingrid Wong
Mommy Can I Have A Snack
Branding
•
Design Research
•
Info Design
•
Motion
•
Packaging
•
•
Product
•
Print
Ingrid Wong
piece of cake
Branding
•
Design Research
•
Info Design
•
Motion
•
Packaging
•
•
Product
•
Branding
Zornitsa Stoimenova
stpl.
Branding
•
Design Research
•
Info Design
•
Motion
•
Packaging
•
•
Product
•
Branding
Zornitsa Stoimenova
Throwback
Branding
•
Design Research
•
Info Design
•
Motion
•
Packaging
•
•
Product
•
Print
Zornitsa Stoimenova
Cyrillic Typography
Branding
•
Design Research
•
Info Design
•
Motion
•
Packaging
•
•
Product
•
Print
Jennifer Louise Huynh
FLEEK
Branding
•
Design Research
•
Info Design
•
Motion
•
Packaging
•
•
Product
•
Product
Zornitsa Stoimenova
Cudō
Branding
•
Design Research
•
Info Design
•
Motion
•
Packaging
•
•
Product
•
Packaging
Thank you! Your submission has been received!
Oops! Something went wrong while submitting the form.
Sean Reibling
YorkU Research Study Infosite
Branding
•
Design Research
•
Info Design
•
Motion
•
Packaging
•
•
Product
•
Info Design
Megan Furlong
The Door in the Wall
Branding
•
Design Research
•
Info Design
•
Motion
•
Packaging
•
•
Product
•
Print
Justin Chiu
The Electric Guitar Sound
Branding
•
Design Research
•
Info Design
•
Motion
•
Packaging
•
•
Product
•
Info Design
Justin Chiu
Fractal Flower Generator
Branding
•
Design Research
•
Info Design
•
Motion
•
Packaging
•
•
Product
•
Product
Justin Chiu
Bets and Blue Jays
Branding
•
Design Research
•
Info Design
•
Motion
•
Packaging
•
•
Product
•
Product
Justin Chiu
Authoritarianism and Air Forces
Branding
•
Design Research
•
Info Design
•
Motion
•
Packaging
•
•
Product
•
Info Design
Gajanan Ketheeswaran
Waypoint
Branding
•
Design Research
•
Info Design
•
Motion
•
Packaging
•
•
Product
•
Product
Gajanan Ketheeswaran
Nightcrawler
Branding
•
Design Research
•
Info Design
•
Motion
•
Packaging
•
•
Product
•
Motion
Gajanan Ketheeswaran
Urban Metamorphosis
Branding
•
Design Research
•
Info Design
•
Motion
•
Packaging
•
•
Product
•
Print
Megan Furlong
The Romanticization of Mental Illness
Branding
•
Design Research
•
Info Design
•
Motion
•
Packaging
•
•
Product
•
Design Research
Megan Furlong
The Performance of Self
Branding
•
Design Research
•
Info Design
•
Motion
•
Packaging
•
•
Product
•
Print
Megan Furlong
How COVID-19 Affects the Body
Branding
•
Design Research
•
Info Design
•
Motion
•
Packaging
•
•
Product
•
Info Design
Megan Furlong
Musical Movies
Branding
•
Design Research
•
Info Design
•
Motion
•
Packaging
•
•
Product
•
Info Design
Raven Sommerhalder
Cultural Identity
Branding
•
Design Research
•
Info Design
•
Motion
•
Packaging
•
•
Product
•
Print
Iris Mamac
Kainan Na
Branding
•
Design Research
•
Info Design
•
Motion
•
Packaging
•
•
Product
•
Design Research
Zornitsa Stoimenova
HORST Arts & Music Festival
Branding
•
Design Research
•
Info Design
•
Motion
•
Packaging
•
•
Product
•
Print
Mariam Hoda
MuslimFest Poster
Branding
•
Design Research
•
Info Design
•
Motion
•
Packaging
•
•
Product
•
Branding
Jethro Sanchez
Winterlude Visual Identity
Branding
•
Design Research
•
Info Design
•
Motion
•
Packaging
•
•
Product
•
Branding
Myah Wills
Myah's Mood Mapping
Branding
•
Design Research
•
Info Design
•
Motion
•
Packaging
•
•
Product
•
Info Design
Myah Wills
Intrusive Inner Voice Project
Branding
•
Design Research
•
Info Design
•
Motion
•
Packaging
•
•
Product
•
Design Research
Iris Blanco
Westminster Dog Festival
Branding
•
Design Research
•
Info Design
•
Motion
•
Packaging
•
•
Product
•
Gajanan Ketheeswaran
Floorplan
Branding
•
Design Research
•
Info Design
•
Motion
•
Packaging
•
•
Product
•
Product
Kalli Jones
Don't Judge a Book
Branding
•
Design Research
•
Info Design
•
Motion
•
Packaging
•
•
Product
•
Print
Bella Wei
Digital Ghosts
Branding
•
Design Research
•
Info Design
•
Motion
•
Packaging
•
•
Product
•
Design Research
Vyjayanthi Janakiraman
the grief is never ending but so is the love
Branding
•
Design Research
•
Info Design
•
Motion
•
Packaging
•
•
Product
•
Design Research
Hailey Luong
Just Like Home
Branding
•
Design Research
•
Info Design
•
Motion
•
Packaging
•
•
Product
•
Packaging
Ingrid Wong
Lemon Festival
Branding
•
Design Research
•
Info Design
•
Motion
•
Packaging
•
•
Product
•
Branding
Vyjayanthi Janakiraman
La Tomatina Festival
Branding
•
Design Research
•
Info Design
•
Motion
•
Packaging
•
•
Product
•
Packaging
Peri Agate
Warped Perceptions of The World
Branding
•
Design Research
•
Info Design
•
Motion
•
Packaging
•
•
Product
•
Print
Peri Agate
Sapphic Intimacy - Secrecy
Branding
•
Design Research
•
Info Design
•
Motion
•
Packaging
•
•
Product
•
Print
Peri Agate
Sapphic Intimacy - Yearning
Branding
•
Design Research
•
Info Design
•
Motion
•
Packaging
•
•
Product
•
Print
Peri Agate
Sapphic Intimacy - Gossip
Branding
•
Design Research
•
Info Design
•
Motion
•
Packaging
•
•
Product
•
Print